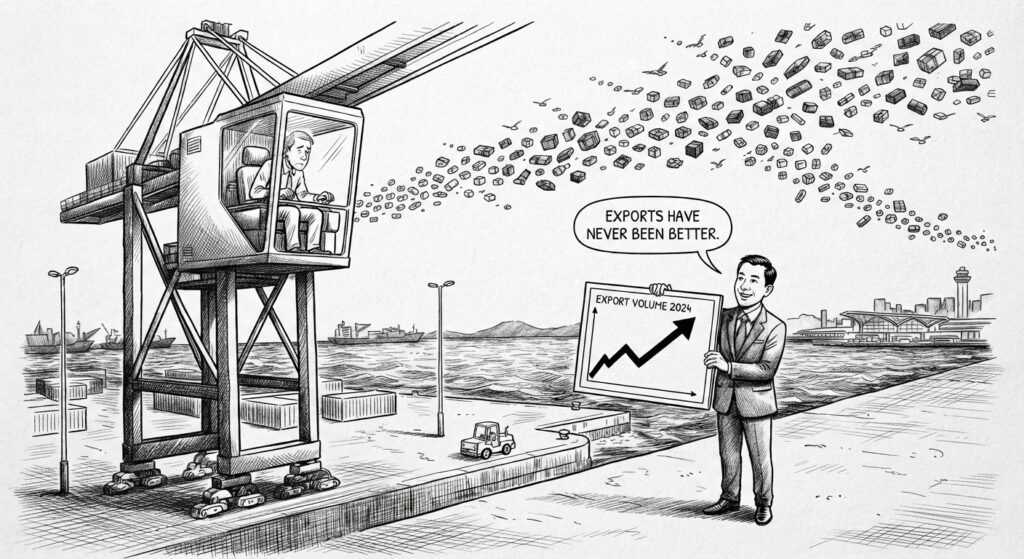
Container throughput fell 3% in the first half of 2026 while merchandise exports surged nearly 40%. The divergence tells you everything about what Hong Kong is becoming, and what it is ceasing to be.
Hong Kong’s Census and Statistics Department released its Q2 shipping data on September 3, and the numbers describe two cities occupying the same harbor. In one, merchandise exports are growing at rates not seen since the 1980s, with June alone posting a 53.4% year-on-year increase to a record HK$641.1 billion. In the other, the port that built this city’s reputation as a global logistics hub handled 6.38 million TEU in the first half of the year, a 3% decline from the same period in 2025. Sea cargo tonnage fell 2.7%. Inbound port cargo dropped 3.8% in Q2.
This is now the fifth consecutive year of container throughput decline. Hong Kong has slipped to fourteenth in Alphaliner’s global port rankings, behind Antwerp-Bruges, behind Tanjung Pelepas, behind ports that would not have appeared in the same sentence a decade ago. The city that once rivaled Singapore for Asian transshipment supremacy is losing physical boxes at a pace that no amount of headline trade data can disguise.
The question for logistics operators is whether this divergence is a statistical curiosity or a structural signal. The answer, unfortunately for anyone with assets tied to Kwai Tsing, is the latter.
The value illusion
The Hong Kong government’s own Half-Yearly Economic Report, published in August, makes the mechanics of the divergence explicit. It notes that trade in semiconductors, processors, and related products rose 21.9% globally in 2025, according to WTO estimates, outpacing the 7% increase in overall world merchandise trade and accounting for 42% of total global trade growth.
Hong Kong sits at the center of that flow. The mainland routes roughly one-third of its integrated circuit exports through the city. The government report states plainly that these products now comprise around 70% of Hong Kong’s total merchandise exports. Their export value grew 63.7% year-on-year in Q2, compared with 41.5% in Q1.
Here is what that means in plain terms: the vast majority of Hong Kong’s export growth is driven by a narrow category of high-value, low-volume electronics. These goods are overwhelmingly moving by air, not by sea. A single pallet of advanced semiconductors can be worth more than a forty-foot container of furniture. When your trade statistics are denominated in dollars and your port statistics are denominated in TEU, you can have explosive growth in one while the other quietly erodes.
Bruce Pang, director of research at the Hong Kong Trade Development Council, acknowledged this dynamic in his July statement accompanying the June trade data, noting that “Hong Kong’s merchandise exports could see moderating growth momentum in the coming months, amid a likely gradual steadying of the technology upcycle.” His forecast for full-year export growth of “over 20%” rests heavily on the continuation of a single tech cycle.
Where the boxes went
The port’s decline is not new. It is a structural trend driven by geography, cost, and infrastructure investment that has been playing out for well over a decade. Neighboring mainland ports, particularly Shenzhen’s Yantian and Shekou terminals and Guangzhou’s Nansha facility, have steadily absorbed the container volumes that once transited through Hong Kong. They are cheaper. They are closer to the Pearl River Delta manufacturing base. And they have invested aggressively in capacity while Hong Kong’s terminal operators have been managing decline.
The numbers tell the story. Hong Kong handled more than 24 million TEU at its peak in 2007. It handled roughly 13 million in full-year 2025, itself a decline from the prior year, according to the Upply global port ranking. The H1 2026 annualized run rate of approximately 12.8 million TEU suggests the bleeding has not stopped.
Meanwhile, the Q2 data contains a detail that deserves attention: while seaborne cargo fell 3.2%, river cargo actually rose 4.8%. River trade, moving goods between Hong Kong and Pearl River Delta ports, remains a functional part of the ecosystem. But it is a feeder service, not a hub function. It underscores that Hong Kong is increasingly a spoke in a wheel whose hub has shifted north.
What this means for the operator
For ocean carriers and terminal operators, the implications are straightforward. Hong Kong is no longer a capacity growth story. Liner services have been steadily dropping direct calls in favor of mainland alternatives, and this data gives them no reason to reverse course. For NVOs and forwarders routing cargo through the Greater Bay Area, the calculus increasingly favors mainland port options on both cost and transit time.
For air cargo, the picture is different. Hong Kong International Airport handled 2.5 million tonnes in H1 2026, up 4.1%, with transshipment volumes rising 19.5% in June alone. The airport is the direct beneficiary of the electronics boom that flatters Hong Kong’s trade headline. But air cargo growth tied to a single product cycle is not the same as diversified trade health.
The deeper risk is strategic. Hong Kong’s position as a logistics hub has historically rested on the combination of a world-class port, a world-class airport, and a regulatory and financial framework that mainland cities cannot replicate. If the port leg of that stool continues to shorten, the remaining advantages become harder to monetize. Trade finance, insurance, and logistics services follow cargo. When the cargo moves to Shenzhen, the ancillary revenue eventually follows.
Hong Kong’s trade statistics have never looked better. Its port statistics have rarely looked worse. For anyone making infrastructure, routing, or capacity decisions in the Greater Bay Area, the container count matters more than the dollar sign.